Insights UI
The Mambu Insights UI is the web application that comes with Mambu Insights. It shows what Mambu Insights is doing for your tenant: which data products are in your data lake, what each one contains, when it last refreshed, which pipeline runs succeeded, and how many credits you have left. It is also where you request additional data products.
Your tenant has its own address. It follows the pattern https://<your-tenant>.insights.mambu.com. If you do not know your address, ask your Mambu Customer Success Manager.
Signing in
The Insights UI uses your existing Mambu credentials. There is no separate Insights username or password, and the sign in step runs on your Mambu tenant, including any multi factor authentication your tenant enforces.
Mambu Insights must already be enabled for your organisation. If you are not sure whether it is, or you do not have your Insights address, contact your Mambu Customer Success Manager or Mambu Support.
Step 1: Grant the Insights permission
Administrator users of your Mambu tenant have access to the Insights UI automatically and can skip to step 2.
Every other user can sign in only if their role includes the Insights, General Access permission. An administrator assigns it:
- Log in to your Mambu tenant as an administrator.
- Go to Administration > Access > Roles.
- Open the role assigned to the user and click Edit.
- In the Permissions section, scroll to the bottom and select Insights, General Access.
- Save the role.
The change applies to every user who has this role. For more information about roles, refer to Roles.
Step 2: Sign in
There are two ways in. Both use your Mambu credentials.
From Mambu
- Log in to your Mambu tenant.
- Click the Insights link in the Mambu navigation.
You are taken to the Insights UI and signed in automatically.
From the Insights address
- In your browser, open your Insights address.
- Click Mambu Sign in.
- You are redirected to your Mambu sign in page. Enter your Mambu credentials.
- You are redirected back to the Insights UI and signed in.
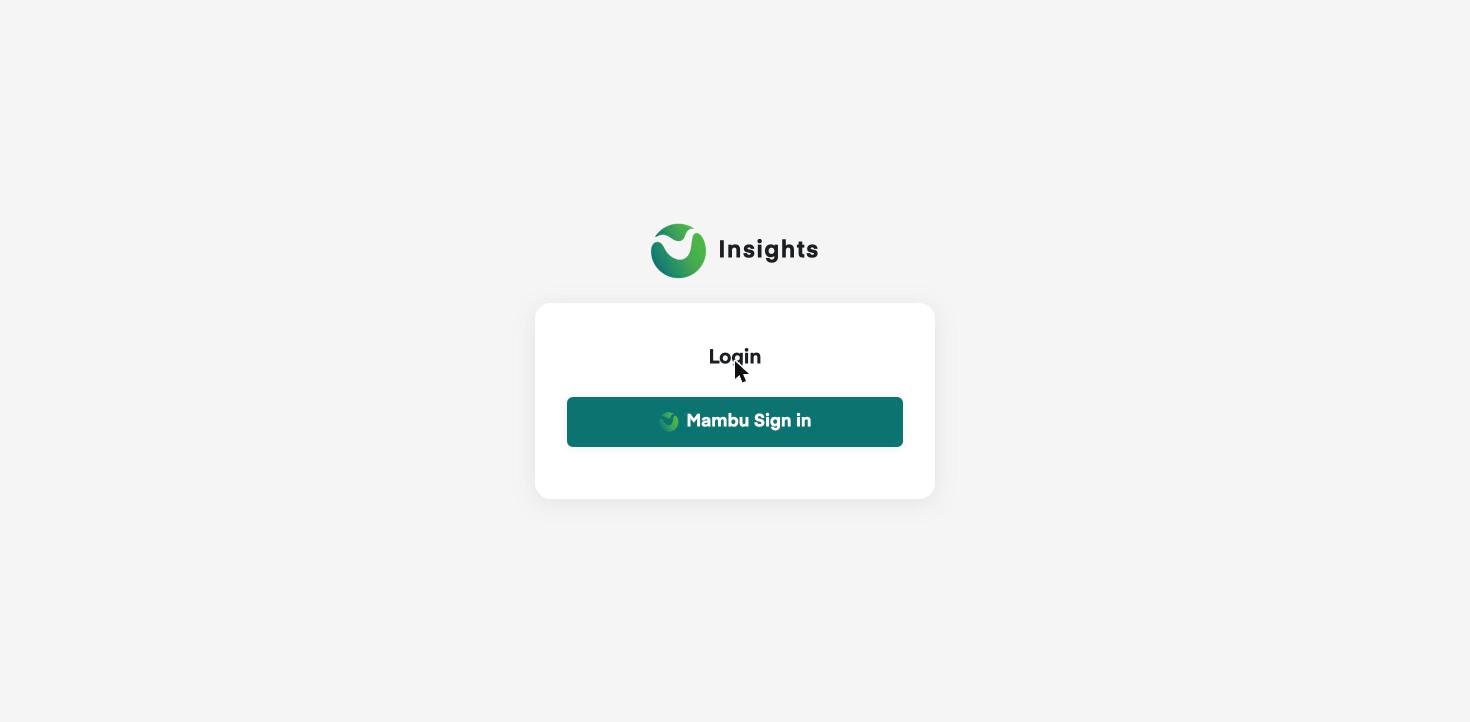
To sign out, open the account menu at the top right (it shows the address you are signed in with) and click Sign out.
Troubleshooting sign in
| Symptom | What to check |
|---|---|
| There is no Insights link in Mambu | Confirm the user's role has Insights, General Access, then log out of Mambu and back in. Administrator users do not need the permission. |
| Insights, General Access is not listed under the role permissions | Insights may not be enabled for your tenant yet. Contact your Customer Success Manager or Mambu Support. |
| After Mambu Sign in you are signed in as the wrong user | Log out of Mambu, then start again from the Insights address. |
| You cannot sign in to Mambu itself | Reset your password with Lost your password? on the Mambu login page. If your organisation uses single sign on, sign in through your identity provider. An administrator can reactivate a locked account. |
| You do not know your Insights address | Contact your Customer Success Manager or Mambu Support. |
| An error appears after you are redirected back to Insights | Raise a request with Mambu Support. Include your tenant name, the affected username, which of the two sign in routes you used, and the error message or a screenshot. |
Finding your way around
The header carries the Mambu Insights name, the tenant selector, a New Query button, the light and dark theme switch, and the account menu. New Query opens the Query Editor, which is enabled per tenant; where it is not, the button returns you to the Dashboard. The tenant selector shows the tenant you are looking at together with its region. If your organisation has more than one Insights tenant, you can search and switch between them there. Every page in the UI shows the data of the selected tenant.
The sidebar on the left starts with the Dashboard and continues in three groups:
| Group | Entry | What it is for |
|---|---|---|
| Dashboard | Your landing page: product counts, pipeline health and recent runs | |
| Data Lake | Overview | Table counts per layer, storage size and batch pipeline statistics |
| Data Lake | Catalog | Every data product Mambu Insights offers, with the ones in your lake marked. The entry expands into Standard, Snapshots and Insights views |
| Data Lake | Job Executions | The list of batch pipeline runs with their logs |
| Trace | Compliance | The point in time reader for compliance investigations. Shown for every tenant but only enabled where the capability has been switched on; otherwise it is greyed out with a note to contact Mambu |
| Administration | Billing | Your credit balance and daily consumption |
Click the Mambu logo in the header to collapse or expand the sidebar.
Dashboard
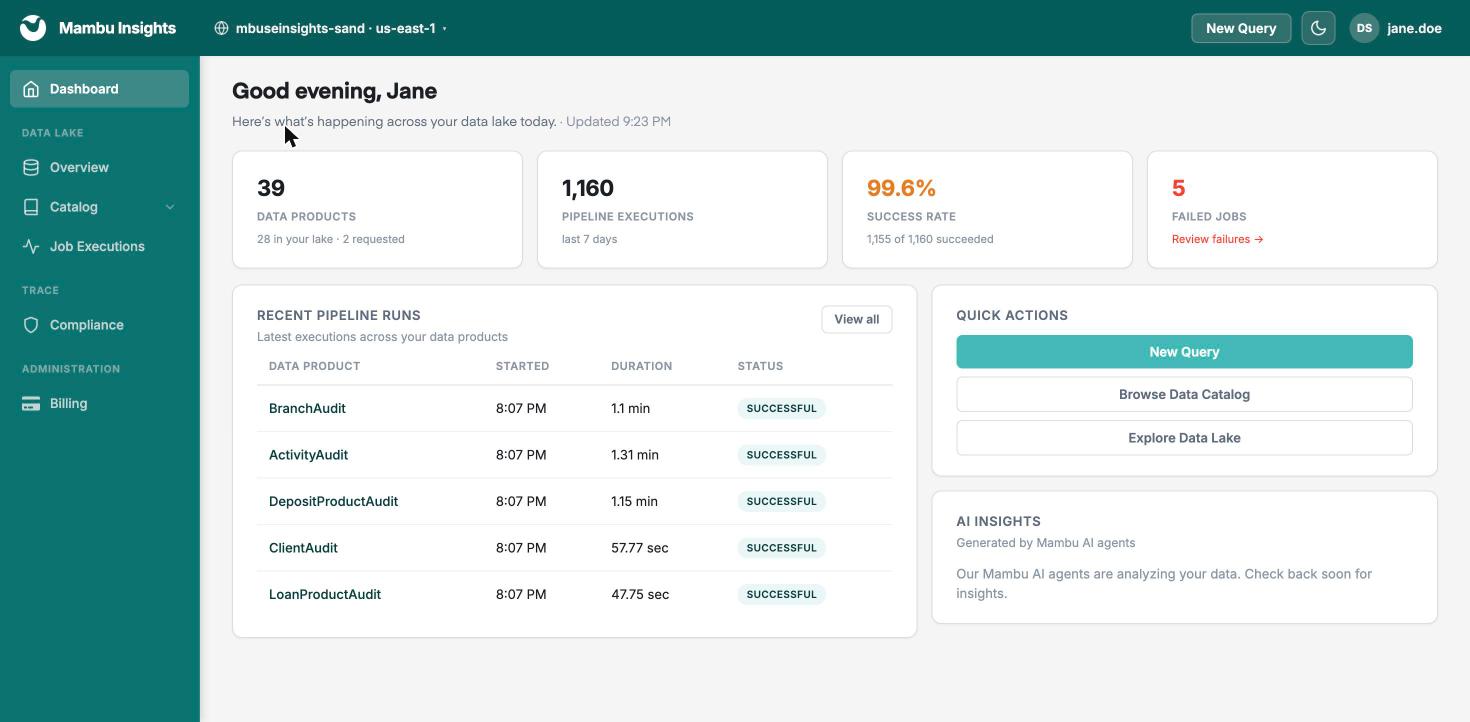
The Dashboard opens after sign in. It summarises your tenant in four tiles:
- Data Products: how many products the catalog offers, with a footer that says how many are in your lake and how many you have requested. Click it to open the Catalog.
- Pipeline Executions: the number of batch runs in the last seven days. Click it to open Job Executions.
- Success Rate: the share of those runs that succeeded, with the count below it.
- Failed Jobs: the number of failed runs in the same window. Click it to review them.
Below the tiles, Recent Pipeline Runs lists the five most recent batch runs with the data product, start time, duration and status. Click a product name to open its product page, or View all to open Job Executions. Quick Actions repeats the New Query button and takes you to the Catalog and the Data Lake overview. The AI Insights card shows findings produced by Mambu AI agents where they are enabled for your tenant.
Run counts and the success rate cover batch pipelines: Gold data products, snapshots and maintenance jobs. The Bronze and Silver layers are processed continuously by streaming and do not appear as runs. For the freshness of a Bronze or Silver table, open the table from the Catalog.
Data Lake overview
The Overview page gives you the shape of your lake:
- Key Catalog Metrics: the total number of tables, the number in each of the Gold, Silver and Bronze layers, and the total data size. Explore Catalog opens the Catalog.
- Key Batch Pipeline Metrics: success rate, total runs, average duration, failed runs and the longest run. Explore Pipelines opens Job Executions.
- Key Query Metrics: marked as coming soon.
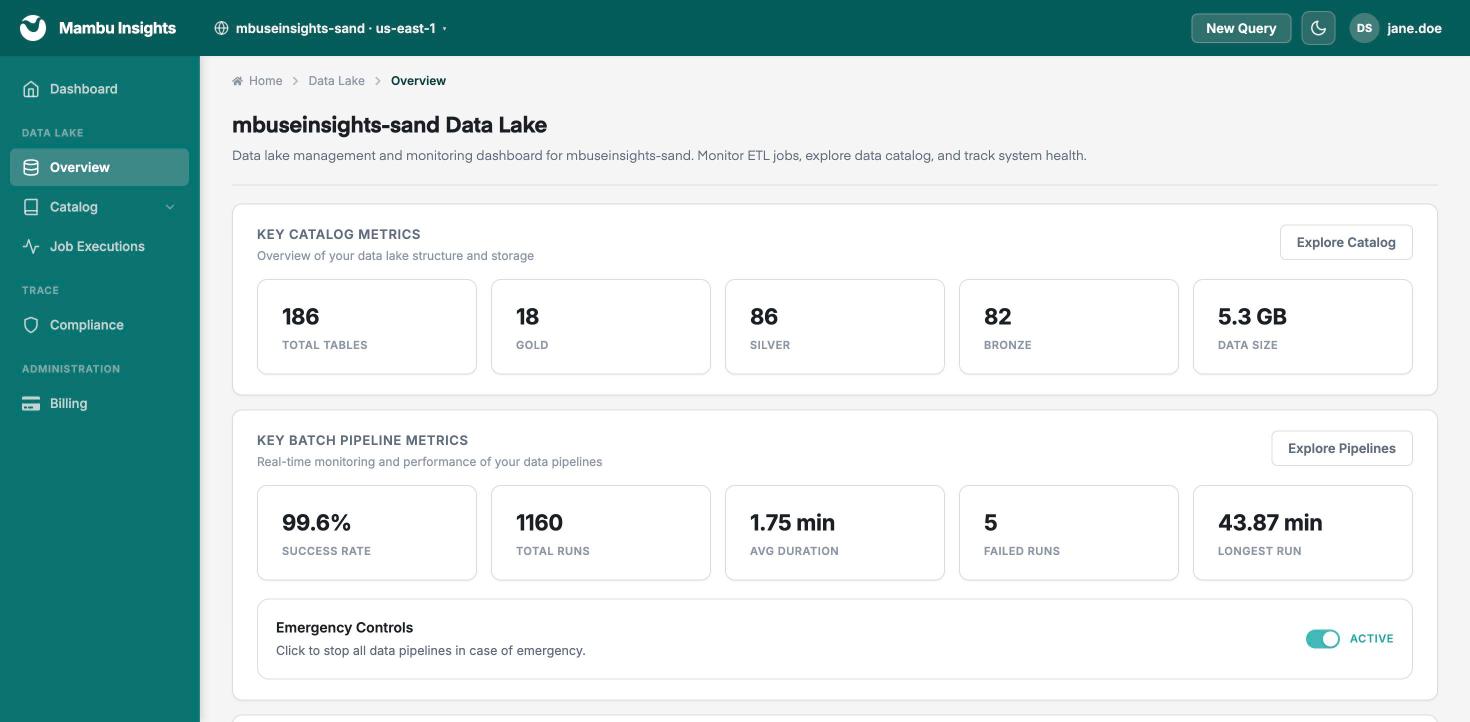
The Overview page carries an emergency stop switch for your pipelines. Pulling it stops all data pipelines for your tenant; nothing refreshes until you reset it from the same place. Use it only when you need your data to stop changing, for example during an incident investigation, and contact Mambu Support if you are unsure.
For what the three layers contain, refer to Mambu Data Lake.
Catalog
The Catalog is a storefront of every data product Mambu Insights offers, not only the ones your tenant has. It is the place to see what a product contains before you ask for it.
Reading the catalog
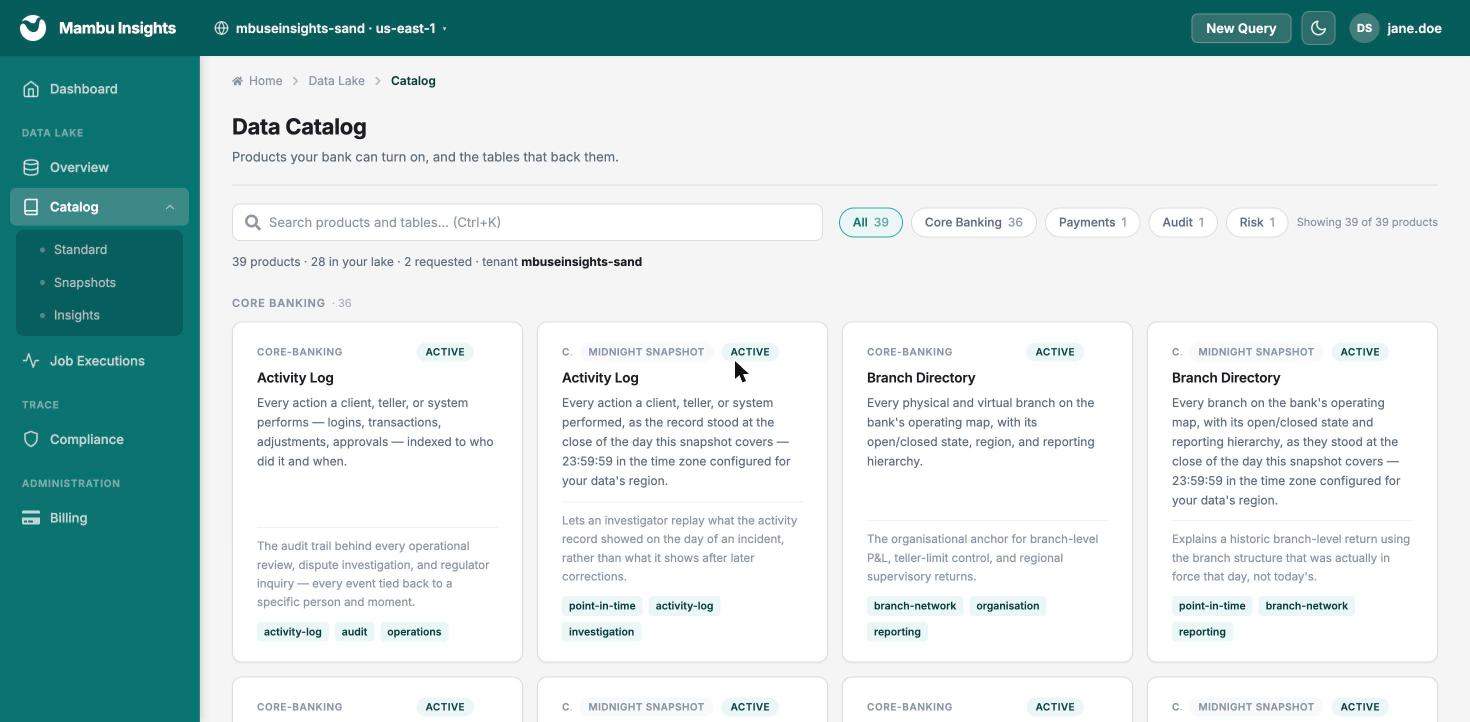
Products are grouped by business domain: Core Banking, Payments, Audit and Risk, plus an Other group for tables in your lake that have no published description yet. A row of chips above the grid filters by domain and shows the count in each. The search box searches product names, descriptions, keys, tags and badges; press Ctrl+K to jump to it. A line under the toolbar tells you how many products the catalog holds, how many are in your lake and how many you have requested.
Each card shows the domain, the product name, what the product does, its business value and its tags. Two labels in the top corner tell you what kind of product it is and whether you have it:
| Label | Meaning |
|---|---|
| Active | The product is in your lake and refreshing. |
| Available | You do not have this product yet. You can request it from its product page. |
| Requested | A request has been recorded for this product and is waiting for Mambu to enable it. |
| MIDNIGHT SNAPSHOT | A point in time copy of a Gold product. Refer to Snapshots. |
| INSIGHT | A derived product that computes something from your data rather than mirroring it, such as a reconciliation or a risk indicator. |
Standard Gold products carry no type badge. Products you star on their product page appear in a Starred section at the top of the catalog for that tenant.
Standard, Snapshots and Insights views
The Catalog entry in the sidebar expands into three views that filter the grid by product kind. A chip naming the active view appears next to the domain chips, with a cross to clear it.
The Standard view adds a Gold, Silver and Bronze tab strip with the number of tables in each. Gold shows the product cards. Silver and Bronze list the tables of those layers that are present in your lake, one card per table, and are empty when the layer is not enabled for your tenant. Silver and Bronze are enabled on request through your Customer Success Manager; refer to Layer availability.
At the bottom of the Catalog, a collapsed All tables section lists every table across the three layers for engineers who prefer a flat list. Click a table to open its schema and commit history in a side panel.
Product page
Click a card to open the product page. The header repeats the domain, the badges and the product description, and carries the actions: a star to bookmark the product, Request access or Withdraw request depending on the state, Open Point in Time on products covered by the Compliance reader where that capability is enabled, and a link back to the Catalog.
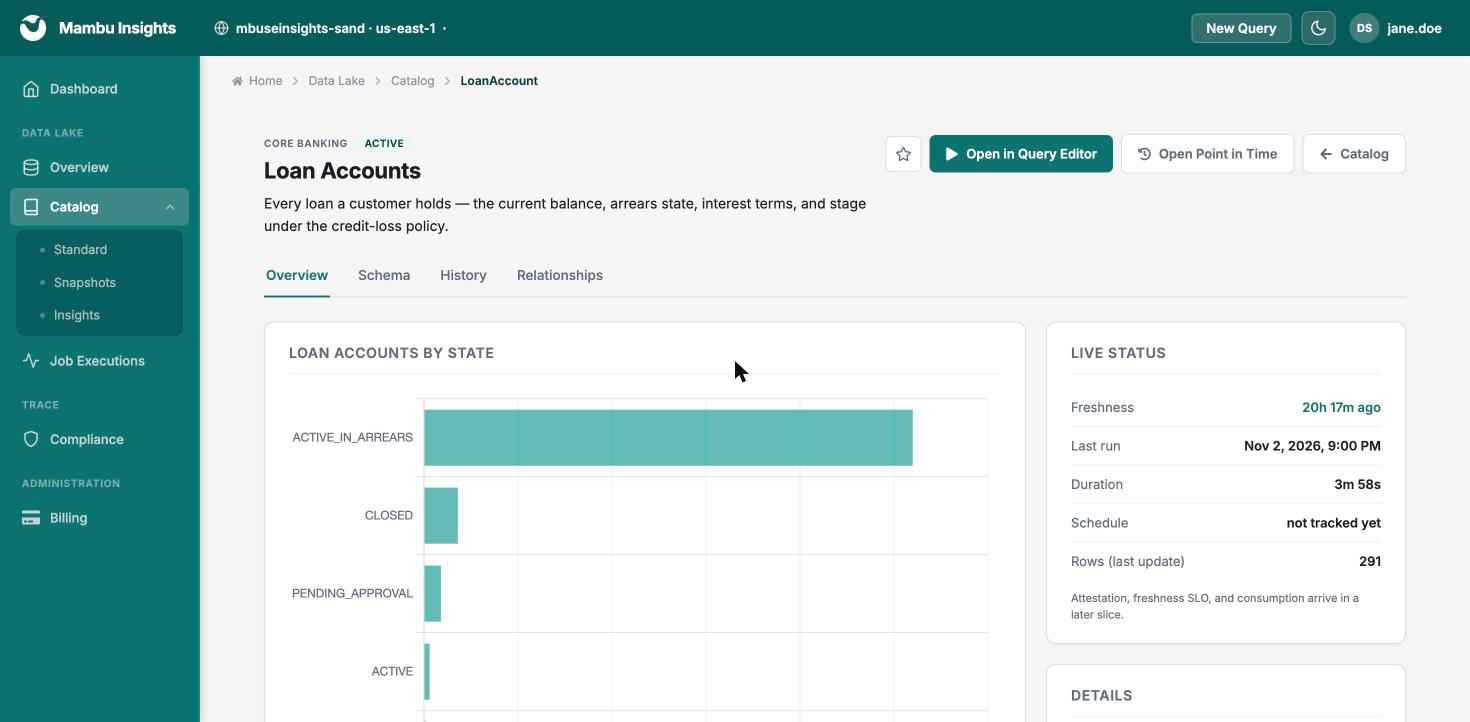
The page has up to four tabs:
- Overview. A Live Status panel with freshness, last run, duration, schedule and the number of rows in the last update; a Details panel with the total row count, size on disk and partition columns; and a Sample data panel with the first rows of the product, read live from your lake. Some products add a chart or a reconciliation summary above the sample.
- Schema. Every column with its type, description and tags.
- History. The transaction log of the product's table: the 50 most recent commits with version, timestamp, operation and the number of rows written. Click a version for the full commit record. This is the evidence an auditor asks for when they want to know when a table changed.
- Relationships. Inferred links between this product's columns and other products, shown only when any have been found.
A product you do not have yet still opens. Its Schema tab shows the columns from the product definition, the Sample data panel shows illustrative rows that are not from your tenant, and the Live Status, Details and History panels say that the product is not enabled for your tenant. Nothing is requested from your lake until you enable the product.
For the full field reference of every product, refer to the Insights Data Catalog.
Requesting a data product
Any product marked Available can be requested from the UI, including the midnight snapshot products.
- Open the product page.
- Click Request access.
- Read the confirmation. It reminds you that once enabled the product runs on your data lake and consumes credits from your remaining balance, so your credits may run out sooner.
- Click Request access again to confirm.
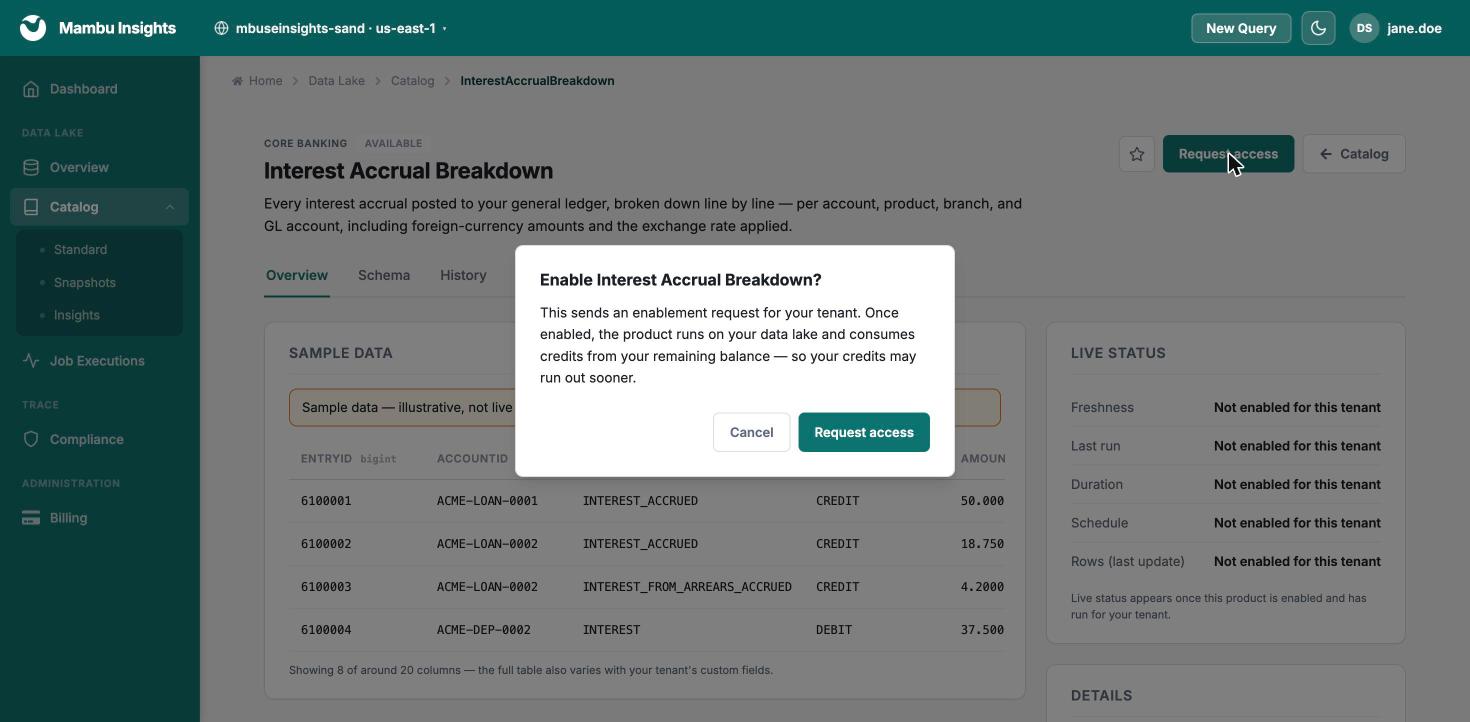
The product's label changes to Requested and the page confirms that the request has been recorded. The request is recorded against your tenant; nothing is enabled automatically and nobody is paged. Talk to your Customer Success Manager to take it forward, especially for products whose configuration needs a decision from you, such as the snapshot time zone. For pricing and credit consumption, refer to Pricing and Consumption.
To cancel a pending request, open the product page and click Withdraw request. The product returns to Available.
The Silver and Bronze layers, the end of day snapshot, Change History and the Compliance reader are enabled per tenant through your Customer Success Manager. Refer to Snapshots and Change History.
Job Executions
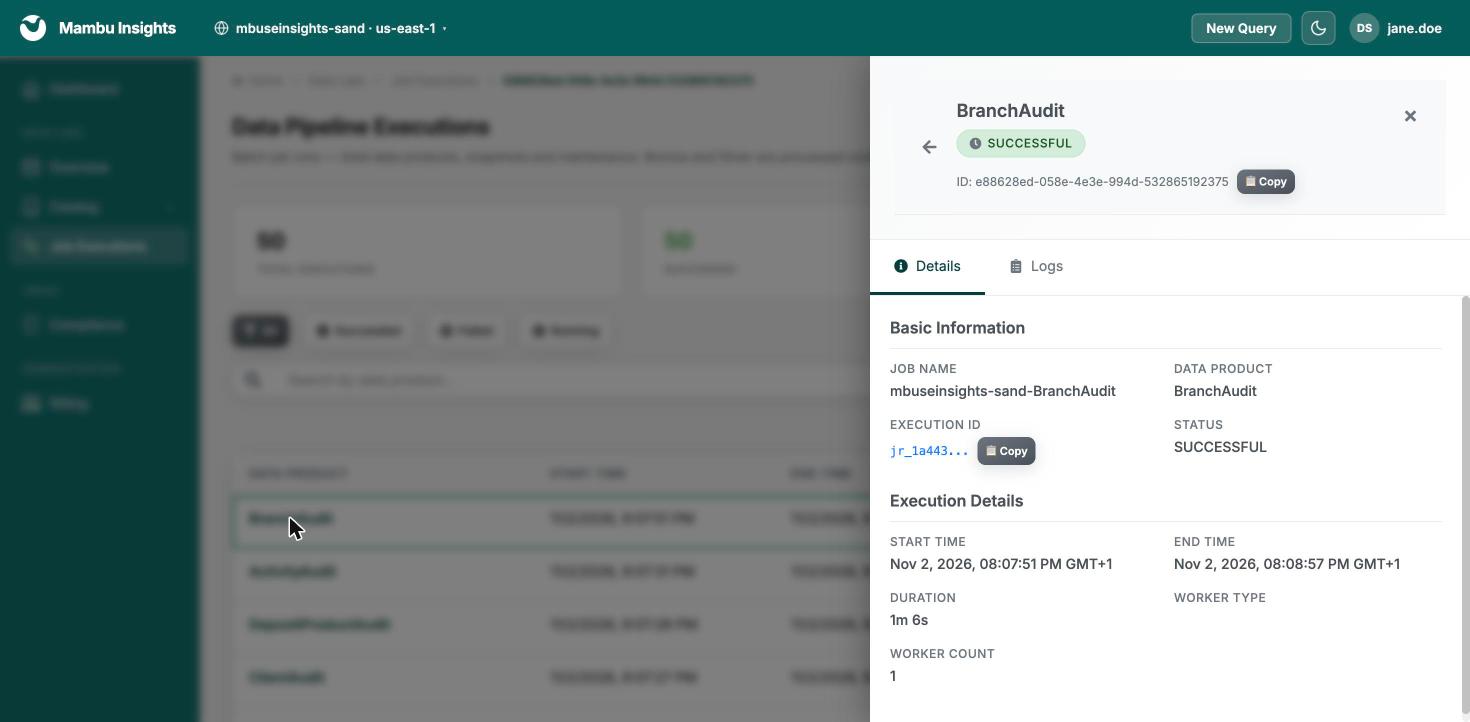
Job Executions lists the batch pipeline runs of your tenant: Gold data product refreshes, snapshot runs and maintenance jobs. Three tiles count the total, succeeded and failed runs, filter buttons narrow the list by status, and the search box filters by data product. Each row shows the data product, start time, end time, duration and status. Click a row to open a side panel with the run details and its logs. The panel has its own address, so you can share a link to a specific run with a colleague or with Mambu Support.
Billing
The Billing page shows your credit position for the selected tenant:
- Remaining credits, with the share of your purchased credits still unused.
- Used credits, with the date the figure was last updated.
- Purchased credits, with the date the earliest batch expires.
Below the tiles, Credit History lists one row per day with the total, consumed and remaining credits and the daily change. Scroll down to load older days; the history goes back one year. For how credits are consumed, refer to Pricing and Consumption.